Google ranking fluctuations are a normal part of how search works: positions shifting by 1 to 5 spots on any given day fall within expected operating range, and a single day of data is not a basis for action.
What matters is whether the movement you are seeing is routine volatility or a sustained pattern that signals a real problem.
That distinction comes down to duration, breadth, and what Google Search Console data shows beneath the surface position number.
The symptoms look identical at first glance: your position changed. Telling them apart is what the rest of this guide walks through, from the benchmark ranges that define normal to the step-by-step check that confirms when a drop is real.
Why Google Rankings Move Every Day
Google does not apply a ranking decision and leave it fixed. The system runs continuously, re-evaluating pages against fresh signals.
Every time Google re-crawls a page, a link changes, a competitor updates their content, or user engagement patterns shift on a given query, the rankings adjust. This happens across millions of searches at the same time.
Continuous unannounced updates
Google has confirmed that in addition to its named core updates, it runs smaller updates on an ongoing basis. These are not announced, do not have names, and are not listed on any status page.
They happen in the background as Google refines how its systems assess quality signals. The practical effect is a higher baseline of daily volatility than existed a few years ago.
Competitor improvements
Your ranking is always relative to every other page competing for the same query. If a competitor earns a strong new backlink, publishes a significantly improved version of a page, or earns a burst of user engagement signals, your position can move downward without any change on your end.
This is one of the most common causes of gradual ranking decline that has no obvious technical explanation on the surface.
SERP layout changes
AI Overviews, featured snippets, local packs, People Also Ask boxes, and shopping units all compete for space on the same results page as your organic listing. When Google adds or expands one of these features for a query, organic positions are pushed further down the page.
This reduces click-through rate even if your ranking position number has not changed, and it looks like a traffic drop in your analytics when it is actually a SERP structure change.
Local searches add another layer of variance. The same query can return a different local pack and different positions depending on where the searcher is, so local rankings change by location even when nothing on your page has moved.
Crawl timing and index refresh
Google does not crawl and index every page at the same frequency. Pages that were recently updated may take days or weeks to be re-evaluated.
During that gap, rankings can appear to drift until the fresh version is indexed and assessed. This creates short windows of apparent instability that resolve without intervention once Googlebot processes the updated page.
The 2026 Volatility Context
2026 has been an unusually active year for algorithm changes. The March 2026 core update, which ran from March 27 to April 8, was the most volatile on record according to multiple independent tracking tools.
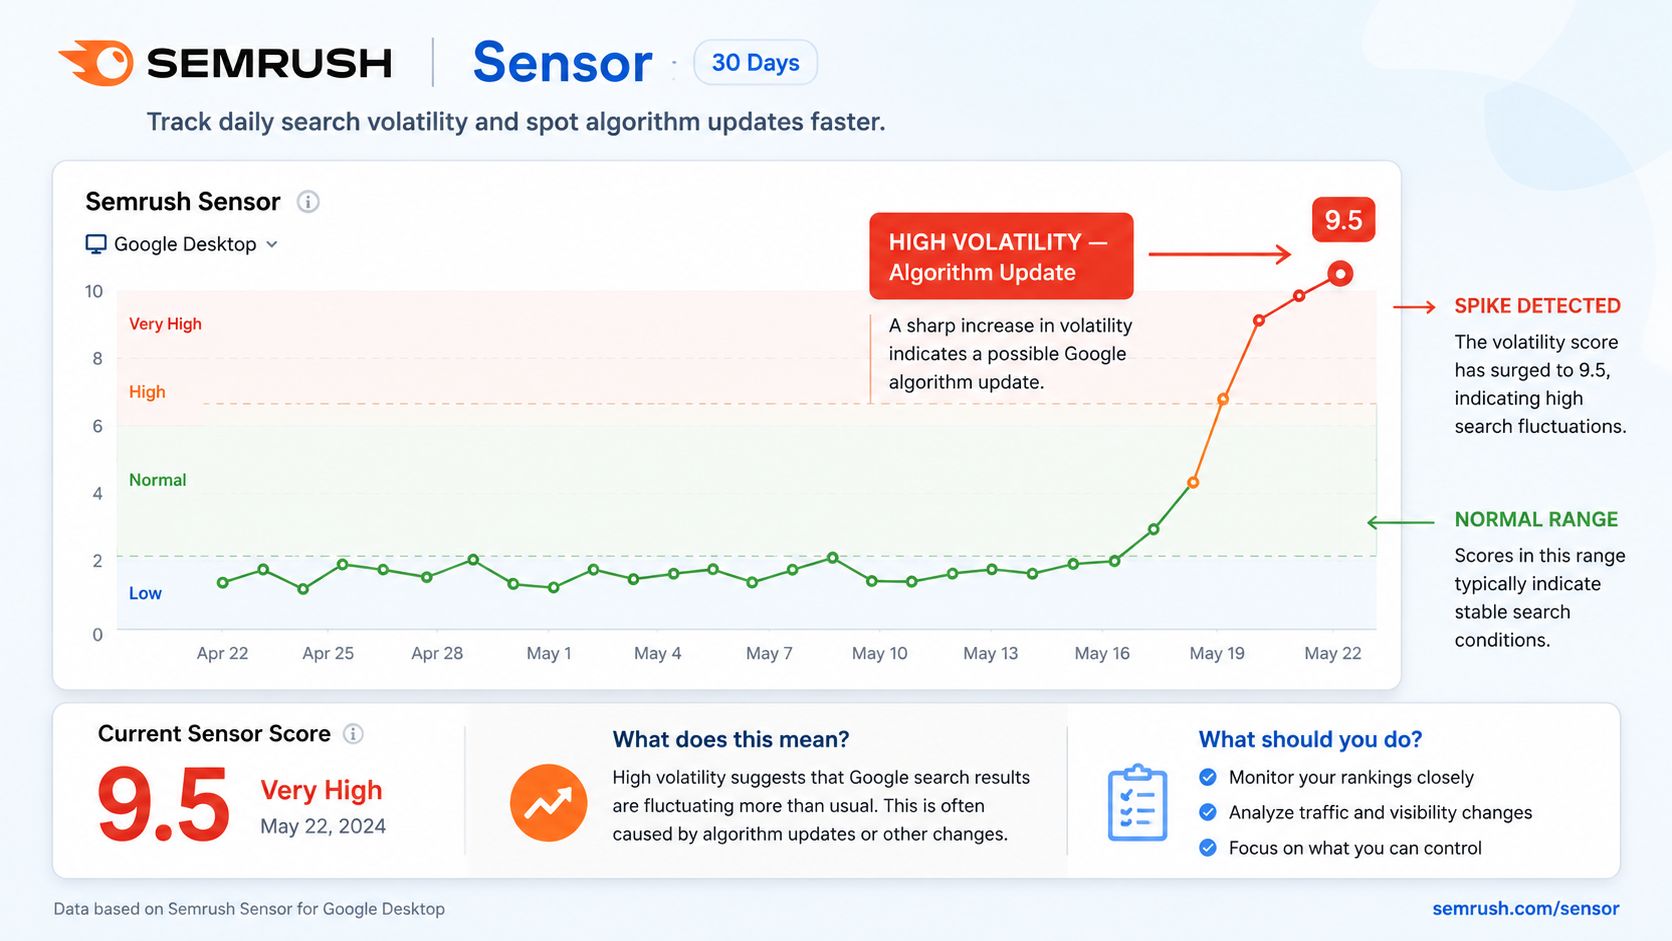
The Semrush Sensor reached a score of 9.5 during late February and early March 2026, and nearly 80 percent of top-3 positions shifted during that window.
If your rankings moved significantly during that period and you have not been able to identify a site-specific cause, there is a reasonable probability the movement was part of a market-wide re-evaluation. That requires a different response from a technical site error or a competitor action.
Confirmed Google core updates through May 2026: March 2025 (March 13 to 27), June 2025 (June 30 to July 17), December 2025 (December 11 to 29), and March 2026 (March 27 to April 8). Comparing your drop date against this list is the first step in diagnosing the cause.
What the Data Shows: Google Ranking Fluctuation Benchmarks
Published volatility studies give you a reference range for what normal looks like. Comparing your own movement against these benchmarks is the fastest way to separate routine noise from a pattern worth investigating.
The figures below draw on aggregated data from the Semrush Sensor and Advanced Web Ranking, both of which track daily position changes across millions of keywords.
| Scenario | Typical daily position shift | Volatility score |
|---|---|---|
| Stable page, non-update day | 1 to 3 positions | Below 5 (calm) |
| Elevated background volatility | 3 to 5 positions | 5 to 8 (moderate) |
| Broad core update rollout | 5 to 20 positions | Above 8 (high) |
A single day inside the upper end of these ranges is still expected behaviour. The benchmark to watch is not the size of one day's move but whether the movement persists past the rollout window or shows up as a sustained impressions decline in Google Search Console.
Fluctuation by Industry: Which Niches See the Most Volatility
Volatility is not evenly distributed across verticals. Semrush Sensor category data has consistently shown that health, finance, and news results move more on an average day than local service or e-commerce results.
The reason is YMYL: Your Money or Your Life. Queries that affect health, money, or safety are re-evaluated more often against E-E-A-T signals, so their baseline volatility runs higher.
If you operate in a high-volatility niche, a wider daily range is normal and is not, on its own, evidence of a penalty or an algorithmic demotion.
How Professionals Separate Noise From Signal
Rank trackers report estimated positions for a set of keywords at a point in time. They are useful for spotting trends, but they do not explain why a position changed, and they can be influenced by personalization, location, and testing pools in ways that make a single day's reading unreliable.
The tools that give context are the volatility trackers.
- Semrush Sensor: Measures daily SERP volatility across 20-plus categories and countries. A score below 5 is calm. Above 8 means significant algorithm activity. Free to use. If your rankings dropped on a day when the Sensor was elevated, the cause is more likely algorithmic than site-specific.
- MozCast: Displays ranking changes as a temperature reading. Higher temperatures correspond to more instability. Useful for cross-referencing with the Semrush Sensor to confirm whether volatility was broad or isolated to a specific category or region.
- Advanced Web Ranking Volatility Tracker: Tracks algorithmic changes with a timeline view of confirmed updates alongside volatility scores, which makes it easier to match your drop date to a named update.
- Google Search Console: Not a volatility tracker, but the most reliable source of data about your specific site's performance. Impressions, clicks, and average position in GSC reflect actual search data, not estimates. This is the primary source for determining whether a drop is real and how long it has persisted.
The key diagnostic workflow is to compare your site's GSC performance data against external volatility signals from the Semrush Sensor on the same dates. If both confirm movement, you are looking at a broad update impact. If only your site moved while the Sensor was calm, you are looking at a site-specific issue.
What Normal Fluctuation Looks Like
These patterns fall within the normal operating range and do not require immediate action:
- Position shifts of 1 to 5 spots in either direction on a given day, particularly when the Semrush Sensor shows elevated volatility on the same date.
- A ranking drop that self-corrects within 3 to 7 days without any changes to the page. Google runs ranking experiments on subsets of users that can create temporary apparent drops which resolve on their own.
- Movement that coincides with a confirmed core update date. Core updates can take 1 to 2 weeks to stabilize. Rankings typically settle once the rollout completes, and the final position after the update is the one that matters.
- Google Search Console impressions remaining stable while rank tracker positions move. If GSC shows you are still getting seen at roughly the same frequency, the rank tracker fluctuation may be a measurement artifact rather than a real change.
When You Have a Real Problem Worth Investigating
These patterns are distinct from normal volatility and warrant a structured diagnosis:
Sustained decline over 14 or more days
A drop that does not recover within two weeks, confirmed in both ranking position and impressions in Google Search Console, is no longer noise. This duration distinguishes a temporary experiment or re-evaluation from a structural re-assessment of your page's quality signals.
Averaging your GSC data across a 14 to 30 day rolling window, rather than checking day by day, shows the actual trend and filters out daily spikes.
Impressions declining in Google Search Console
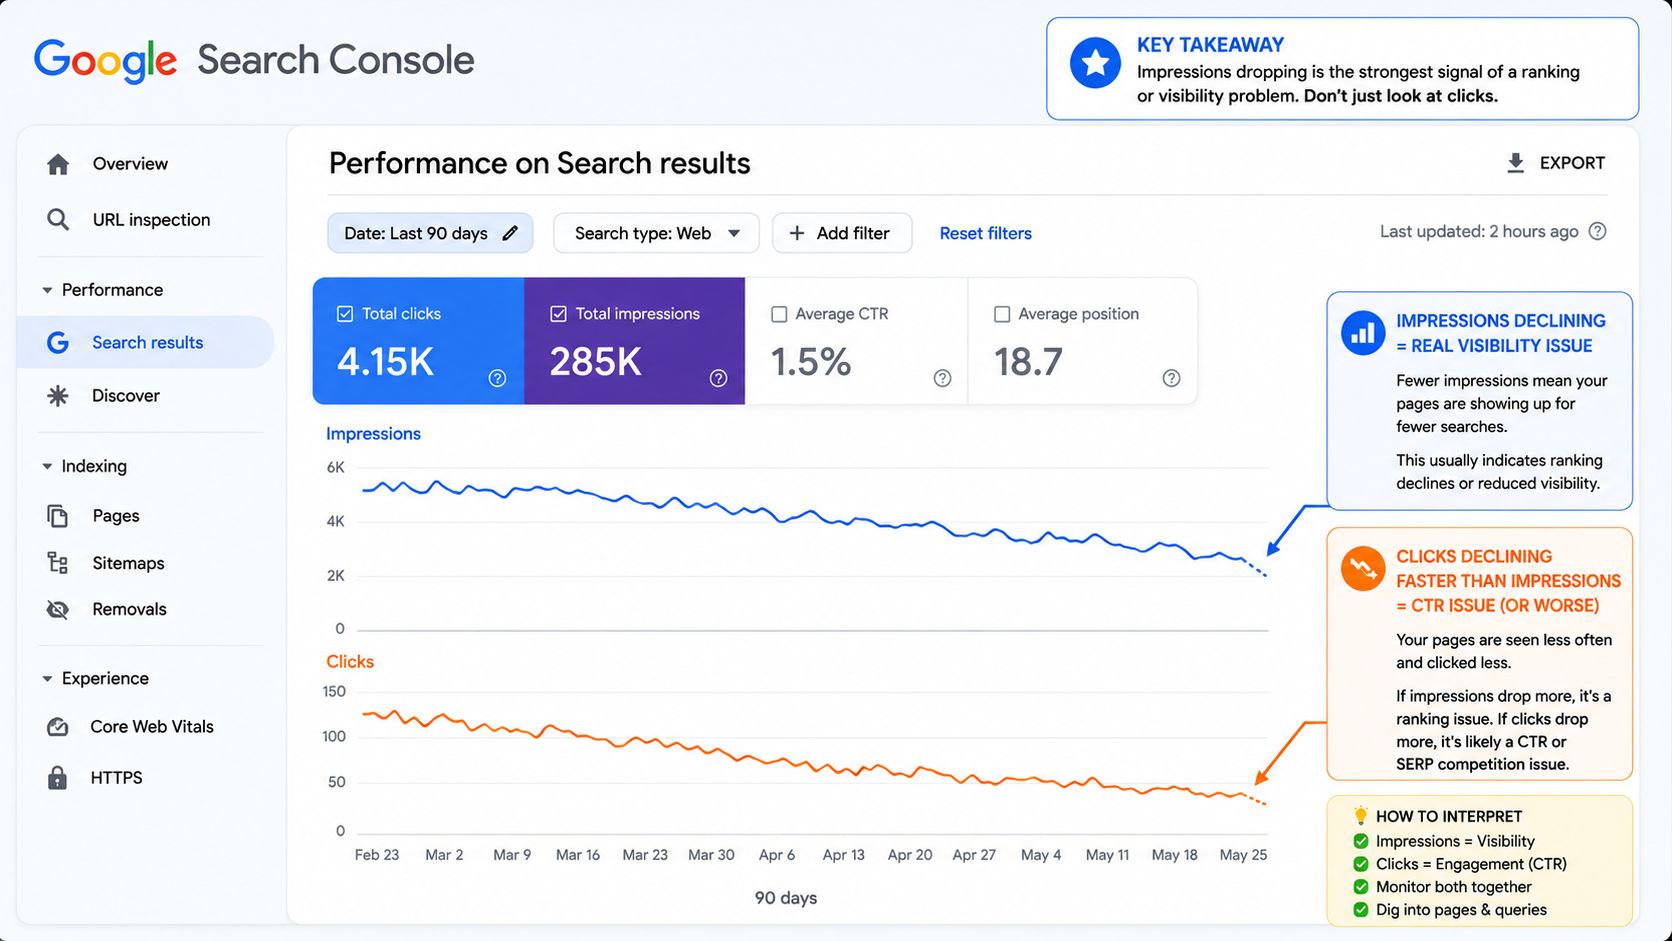
Impressions measure visibility: how often Google shows your pages in search results. A drop in impressions means your pages are appearing for fewer searches, which is the strongest signal of a real ranking or visibility problem.
If rank tracker positions drop but GSC impressions remain stable, the page is still being shown at roughly the same frequency and the rank tracker reading may be unreliable.
When impressions decline consistently over 14 or more days, that is the metric to act on. When clicks decline faster than impressions, the issue is more likely a CTR problem: titles or descriptions that are not compelling enough, or SERP features pushing organic results further down the page.
A sitewide drop across many keywords simultaneously
If your rankings for dozens or hundreds of keywords decline at the same time, the issue is likely structural rather than page-level. A sitewide simultaneous decline usually points to a technical problem, a crawlability issue, a site-level Google penalty, or a core update impact on site-wide quality signals.
Page-by-page content improvements would not produce this pattern, and page-by-page fixes would not resolve it.
The drop happened immediately after a site change
If rankings moved within days of a site redesign, CMS migration, URL restructure, or hosting change, the timing is a strong diagnostic signal.
URL structure changes without proper redirects, noindex tags accidentally applied to live pages, canonical tags pointing to the wrong pages, and site speed regressions from redesigns are all common causes of post-change ranking drops. A technical SEO review after a significant site change catches these issues before they compound.
Your site dropped while competitors held position
If your rankings for a keyword dropped significantly while the top-ranking competitors for the same keyword maintained their positions, the cause is site-specific rather than algorithmic.
A broad update affects all competing sites to some degree. If only your positions moved, the problem is on your side of the equation.
The 30-Second Check for Manual Actions
A manual action is a penalty applied by a member of Google's spam review team, not by the algorithm. It causes some of the sharpest and most sudden ranking collapses and cannot be recovered from without submitting a reconsideration request to Google.
Manual actions affect less than 1 percent of indexed websites, but they are the first thing to rule out when a severe drop occurs because the check takes under a minute.
In Google Search Console: navigate to Security and Manual Actions, then click Manual Actions. If the result is "No issues detected," your site does not have a manual penalty. If a penalty is listed, it will specify exactly which type of violation was found and which pages it applies to.
Technical crawl issues are visible in the Coverage and Pages reports within the same tool and should be checked at the same time.
The Underlying Factor That Makes Sites Vulnerable to Update Impacts
Sites that experience large, sustained ranking drops after core updates tend to share a common profile: pages that scored well enough under the previous algorithm weighting but fall short under a re-calibrated quality threshold.
This is not always about thin content or obvious spam. It can be subtler: pages where the content is competent but not genuinely authoritative, pages where expertise is claimed but not demonstrated through specifics, or pages where signals like links and engagement looked adequate historically but have not kept pace with what competing pages now offer.
Google's core updates are not targeted at specific sites. They are calibrations of how the system weights quality signals across the entire web. If your site was ranking partly on signals that are now weighted differently, the update reveals a gap that was already present.
Closing that gap is the work of on-page SEO optimisation: strengthening the content, structure, and depth on the pages themselves so they hold up under a stricter quality threshold.
Understanding where that gap is requires looking at performance data across pages, not making assumptions based on the ranking movement alone.
An SEO audit addresses this directly. It maps which pages are declining and why, comparing your signals against the pages now outranking you after an update. Knowing where the gap is makes the recovery path specific rather than speculative.
Keyword cannibalization is one structural issue that creates persistent ranking instability independent of algorithm updates. When two pages on your site compete for the same query, neither accumulates full ranking authority, and positions fluctuate unpredictably without an obvious external cause.
How to Read a Ranking Fluctuation Report Step by Step
When a position moves, work through these steps in order. Each one rules out a cause before you spend effort on the next.
- Set the date range to 30 days, not one day. Open the Performance report in Google Search Console and compare the rolling trend. A single day tells you nothing; the trend line tells you whether anything has actually changed.
- Check impressions before clicks. Falling impressions mean your pages are showing for fewer searches, which is a visibility problem. Stable impressions with falling clicks point to a CTR issue instead, such as a weak title or a SERP feature pushing you down.
- Cross-reference the date against volatility trackers. Pull up the Semrush Sensor and Advanced Web Ranking for the same window. If they spiked when you dropped, the cause is broad and external, not site-specific.
- Compare against competitors. If the pages now outranking you also moved, you are seeing a market-wide re-evaluation. If only your site fell, the cause is on your side.
- Rule out technical regressions. Check the Manual Actions, Pages, and Core Web Vitals reports. Page experience problems such as failing core web vitals thresholds in 2026 can suppress positions without any content change.
- Read the underlying audit data, not just the position. If the drop survives the first five steps, the next move is a structured diagnosis. Knowing how to read an SEO audit report lets you map which pages declined and which signals fell behind the competition.
When to Wait and When to Act: The Decision Criteria
This is the question most business owners are actually trying to answer. Acting too early applies changes to something that is not broken. Acting too late allows a real problem to compound.
The decision should be based on specific measurable conditions, not on how the drop feels in the moment.
Wait it out if:
- The drop occurred within a window where the Semrush Sensor was elevated above 7 or a confirmed core update was rolling out.
- Google Search Console impressions have not declined: only rank tracker positions have moved.
- The drop has been present for fewer than 14 days and positions are partially recovering on their own.
- Competitors in your industry show similar movement, confirming a broad re-evaluation rather than a site-specific issue.
Bring in help if:
- GSC shows impressions declining over 14 or more days with no signs of stabilization. Impressions measure visibility: when they fall, your pages are appearing for fewer searches, not just getting fewer clicks.
- The drop is sitewide, affecting many keywords simultaneously, pointing to a structural or technical cause.
- Rankings dropped immediately following a site change, and you cannot confirm whether the change caused a technical issue.
- Your rankings fell while competitors in the same market held position, ruling out a broad algorithmic cause.
- You have experienced sustained post-update declines across multiple update cycles without a clear recovery pattern.
The risk of acting too early on normal volatility is real. Making structural changes to pages that are fluctuating normally can remove signals that were performing well, turning a temporary fluctuation into an actual decline.
Confirm, through GSC data and external volatility tools, that a real problem exists before changing anything.
If that confirmation points to an audit as the next step, knowing what the work involves and the typical SEO audit cost helps you scope it before committing.
For pages stuck at positions 11 to 25 as a baseline, rather than declining from competitive positions, the issue is different from volatility.
How Google Core Updates Differ From Daily Fluctuations
Daily fluctuations are continuous, small, and mostly self-correcting. A broad core update is a discrete, announced event with a defined start and end, and its effects are deliberate rather than incidental.
Google states that broad core updates typically take one to two weeks to fully roll out. Positions can swing widely during that window and only settle once the rollout completes, so the position you see mid-rollout is not the final one.
The scale is the other difference. Core updates re-weight quality signals across the entire index, so they can move rankings for a large share of queries at once rather than for a single page or keyword.
To confirm a core update is the cause, overlay the dates. In Google Search Console, mark the announced rollout start and end against your Performance graph. If your decline begins on the rollout date and steadies when it ends, the update is the likely driver. A drop that started days before or after the window points elsewhere.
This is the dividing line between waiting and acting: a movement that tracks a confirmed rollout calls for patience until positions settle, while a movement with no matching update behind it calls for diagnosis.
Frequently Asked Questions
Why do my Google rankings change every day?
Google's ranking systems run continuously, re-evaluating pages against fresh signals every day: re-crawled content, link changes, competitor updates, and user engagement patterns.
Google also runs smaller unannounced updates between its confirmed core updates, which means the baseline level of daily movement is higher than it was a few years ago. A 1 to 5 position shift on any given day is within the normal range and does not require action.
How much daily ranking fluctuation is normal?
Daily fluctuations of 1 to 5 positions are normal. A drop that recovers within 3 to 7 days without any changes to the page is also within normal range.
The signal worth acting on is declining impressions in Google Search Console sustained over 14 to 28 days. Impressions measure visibility and are more reliable than rank tracker position estimates, which can shift due to personalization, location, and testing pools without reflecting a real ranking change.
How do I know if my ranking drop is from a Google algorithm update?
Check the drop date against confirmed Google update announcements and the Semrush Sensor reading for the same period. If the Sensor was elevated and multiple sites in your industry moved simultaneously, you are most likely seeing a broad update impact.
The March 2026 core update, which ran from March 27 to April 8, was the most volatile on record, with nearly 80 percent of top-3 positions shifting during that window.
When should I be worried about a ranking drop?
The strongest signal of a real problem is declining impressions in Google Search Console, not just declining clicks. Impressions measure visibility. When impressions fall, your pages are appearing for fewer searches.
Declining clicks with stable impressions more often points to a CTR issue: a weak title, a poor meta description, or SERP features reducing organic click share.
A drop warrants investigation when impressions decline consistently over 14 or more days, when the decline is isolated to your site while competitors held position, when it happened immediately after a site change, or when it is a sitewide drop across many keywords at once.
What is the Semrush Sensor and how does it help?
The Semrush Sensor is a free tool that measures daily volatility in Google search results across millions of keywords and more than 20 countries. It assigns a daily score: below 5 is calm, 5 to 8 is moderate, above 8 means significant algorithm activity.
If your rankings dropped on a day when the Sensor was elevated, the cause is more likely algorithmic and broad than site-specific. If the Sensor was low and only your site moved, that points to a site-level issue worth diagnosing.
What causes sudden overnight ranking drops in Google?
A sudden overnight drop usually has one of four causes: a Google core or spam update that rolled out overnight, a technical change on your site recently deployed, a manual action applied by Google's spam review team, or a competitor making significant improvements that shifted positions.
The first step is always to check Google Search Console for manual actions and crawl errors before drawing any conclusions about the cause.
Can my rankings drop if I have not changed anything on my site?
Yes. Rankings are always relative to every page competing for the same query. If a competitor improved their page, earned strong new backlinks, or published content that better matches the current search intent for a query, your position can fall without any change on your end.
Algorithm updates also shift how Google weights different signals, which can affect rankings across an entire industry without any individual site changing anything.
What does a Google rank fluctuation study show about normal movement?
Published volatility studies, including data from the Semrush Sensor and Advanced Web Ranking, consistently show that pages in positions 1 to 3 move an average of 1 to 3 positions on non-update days.
During a confirmed broad core update rollout, which Google states typically takes 1 to 2 weeks to complete, position swings of 5 to 20 spots are documented across competitive niches. Any single-day movement within those ranges is expected behaviour, not a signal of a problem.
Do Google ranking fluctuations affect all industries equally?
No. Semrush Sensor category data has consistently shown that health, finance, and news verticals experience higher average daily volatility than local service or e-commerce categories.
This is partly because YMYL (Your Money or Your Life) queries are re-evaluated more frequently against E-E-A-T signals. If your site operates in a high-volatility niche, a wider daily fluctuation range is expected and is not itself evidence of a penalty or algorithmic demotion.
How is a Google ranking fluctuation different from a ranking drop?
A fluctuation is a temporary position change, typically resolving within 1 to 7 days, that does not alter your average position trend over a rolling 30-day window. A ranking drop is a sustained, directional decline visible in both position data and impressions in Google Search Console over 14 or more consecutive days.
The key diagnostic is duration and breadth: if multiple pages dropped together after a site change or confirmed update, that is a drop worth investigating.

Illan Lebumfacil
Founder of Search Engine Hub and independent SEO specialist with over 10 years of experience. Works directly with local businesses, service providers, and online brands across the Philippines, Australia, and internationally to improve their Google rankings through precise, data-driven strategies.
Read more about Illan's background and approach, or connect directly on LinkedIn.